Uncategorized files
Jump to navigation
Jump to search
Showing below up to 88 results in range #1 to #88.
 2 Crager Formatted June3.pdf ; 300 KB
 AndrewC.png 120 × 126; 35 KB
 BB.jpg 57 × 85; 3 KB
 BGP Business flow.jpg 952 × 1,232; 75 KB
 BGP Business flow 3.jpg 952 × 1,232; 75 KB
 Bullet star.png 16 × 16; 370 bytes
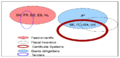
 CEPGISubComponents.png 700 × 525; 29 KB
 CarterSolar.jpg 500 × 474; 198 KB
 China's Energy Policy.jpg 428 × 1,191; 214 KB
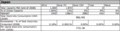
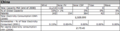 China RE table.png 571 × 149; 29 KB
 Cleantech Investment.png 611 × 367; 36 KB
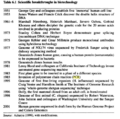
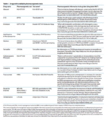 Clinically Available Pharmacogenomics Tests - Table 1.png 595 × 654; 368 KB
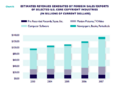 CopyrightIndustryForeignSales--IIPA--pg16--2009.png 859 × 624; 69 KB
 David O'Brien ICP.jpg 136 × 157; 7 KB
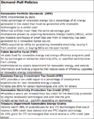 Demand pull policies.png 382 × 485; 88 KB
 DigitalSolutionsK12.png 789 × 499; 83 KB
 EFRC.png 605 × 346; 74 KB
 Energy Deployment Stages and policies from Kofoed - Wiuff.jpg 881 × 305; 141 KB
 Estrela-dourada-2.gif 21 × 17; 187 bytes
 Europe RE table.png 571 × 445; 80 KB
- FFPregressReport.pdf ; 7.88 MB
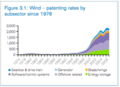 Figure31.png 369 × 268; 55 KB
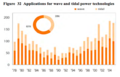 Figure32.png 589 × 379; 171 KB
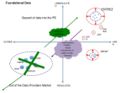 FundDatamap.jpg 668 × 519; 63 KB
 GAOReport--TextbookLifeCycle.png 1,087 × 677; 195 KB
 GenomicsIP.jpg 552 × 343; 38 KB
- Genomics Knowledge Governance.pdf ; 231 KB
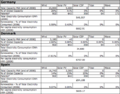
 Germany Denmark Spain.png 571 × 445; 80 KB
 Global Carbon Emitters.png 657 × 523; 76 KB
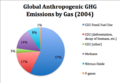 Global GHG Pie.png 610 × 422; 56 KB
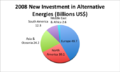 Global energy investment 2008.png 531 × 319; 50 KB
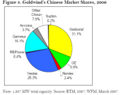 Goldwind Market Share.jpg 456 × 360; 43 KB
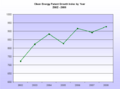
 GrowthPatentsinAE.png 502 × 378; 32 KB
 HigherEdTextbookPublisherPieGraph.png 788 × 545; 42 KB
 ICTSD Stages of Dev.RE energies.png 638 × 339; 136 KB
 ICTSD Stateof art of RE sources.png 557 × 676; 93 KB
 JVC.png 498 × 324; 68 KB
 Japan RE table.png 571 × 149; 29 KB
 K-12TextbookPublisherPieGraph.png 758 × 514; 34 KB
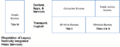 Layers.png 677 × 267; 30 KB
- LimeService Questions4EFRC.pdf ; 203 KB
- LimeSurveyResults.pdf ; 1.79 MB
 Macroforprofit.png 308 × 241; 20 KB
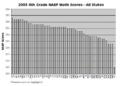 Mathscoresadoptionopen.png 578 × 416; 99 KB
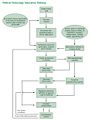 Medical Technology Innovation Pathway.jpg 920 × 1,237; 84 KB
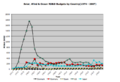
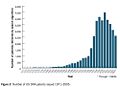 Number of US DNA Patents (Pressman).jpg 500 × 361; 44 KB
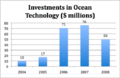 Ocean Tech Inv.png 566 × 369; 33 KB
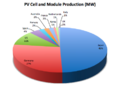 PV CellandModuleProduction.png 469 × 422; 42 KB
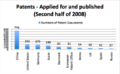 PatentsApp.for.png 542 × 332; 42 KB
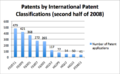 PatentsClass.png 543 × 333; 44 KB
 PatentsOverall.png 572 × 424; 37 KB
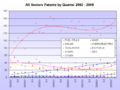 PatentsQuarter.png 571 × 426; 80 KB
 Picture 1BGP.png 491 × 486; 79 KB
 PoliciesandCountries.png 453 × 219; 35 KB
 Promotion strategies.png 470 × 325; 43 KB
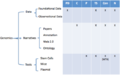
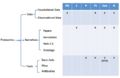 ProteomicsIP.jpg 559 × 363; 38 KB
 Renewable RD Budgets.png 682 × 466; 69 KB
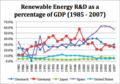 Renewables RD perc of GDP.png 599 × 417; 88 KB
 Screen shot 2010-04-19 at 7.39.54 PM.png 552 × 343; 32 KB
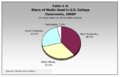 Simba--ShareofMediaUsedinUSCollegeClassrooms--pg14.png 649 × 416; 41 KB
 Solar PV Comparison.png 572 × 347; 47 KB
 SunPower Core IP.jpg 940 × 316; 60 KB
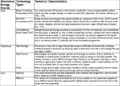 Tech Descriptions.png 681 × 490; 119 KB
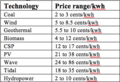 Technology prices.png 344 × 235; 30 KB
- Telecommunications.pdf ; 325 KB
 TextbookQuadrants.png 720 × 540; 97 KB
 The Economic Impact of Licensed Commercialized Inventions.jpg 952 × 549; 100 KB
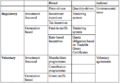
 Thornton-Ocasia--EditorialvMarketLogicTable--p809.png 660 × 443; 82 KB
 Top 30 entities holding US DNA Patents (Pressman).jpg 532 × 423; 58 KB
 Top Univ holding DNA Patents (Pressman).jpg 530 × 649; 138 KB
 Top wind manufacturers.png 498 × 245; 38 KB
 Total renewable RD from 1985.png 682 × 466; 73 KB
 US Energy RD&D spending.png 614 × 419; 47 KB
 US RE table.png 571 × 149; 31 KB
 US System of Oversight of Genetic Testing p247 - 2008 SAGCHS.png 1,325 × 991; 327 KB
 Uni Govt Firm flow chart.jpg 952 × 1,232; 100 KB
 Univ Pressman.jpg 392 × 260; 47 KB
 ValueChain.jpg 1,658 × 1,066; 513 KB
 Value Chain Graphic.jpg 1,658 × 1,066; 296 KB
 Wata1.png 531 × 326; 61 KB
 Wata2.png 550 × 325; 65 KB
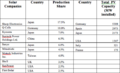
 Windcompanies.png 502 × 212; 39 KB


.jpg)


.jpg)
.jpg)


